Author: Sam Bullers
Contributors: Sam Bullers, Rachel Feeney, Sandi Yen, Nick Ilott, Jim Wicks (YouSeq)
Updated: today
Exectuve Summary
This pilot study is a follow-up on the Comparison of DNA Extraction Methods
The ZymoBIOMICS Microbial Community Standard is comprised of 10 microbes in known quantities. The Community Standard was diluted from neat to 1:1000000 to determine at what point the extracted DNA was no longer detected by Nanodrop analysis. Using the approximate cell concentration of the ZymoBIOMICS Microbial Community Standard provided by Zymo Research, dilutions could be converted to cell number for application in ‘real world’ studies. DNA extracted using the optimum homogenisation method and preferred extraction kit, identified in DNA extraction methods pilot study, was used. At the dilutions 1:100 to 1:1000000, DNA concentrations were recorded as being low. 16S amplification and library preparation was performed on these samples using the YouSeq NGS 16S kit. Products of the 16S amplification ran on a gel showed a DNA band down to a dilution of 1:100000, indicating that very low input DNA could still be amplified and detected with 16S PCR. This library was then pooled and sequenced. Sequencing of the pooled library revealed that all of the microbes within all dilutions of the ZymoBIOMICS Microbial Community Standard could be detected at the genus level. Further, only a decrease in percentage of reads was observed at dilutions of 1:100000 and 1:1000000, corresponding to approximately 28000 and 2800 cells respectively. The PCR no template control showed no reads assigned to that sample, while the kit only control showed some low-level contamination, indicating some potential experimental contamination, either environmental or cross. Adjusting for the mean number of reads showed that the number of reads returned for the PBS kit control was negligible and that the ZymoBIOMICS microbial community standard can be diluted down to 280000 bacterial cells and provide adequate results by 16S sequencing.
Objective
Determine the lowest concentration of DNA required for 16S rRNA gene analysis.
Aims
- Understand at which dilution of the serially diluted community standard, the Nanodrop no longer detects DNA and if diluting the standards affects which species within the standard are detected.
- Establish a 16S library preparation protocol using a commercially available kit and determine if the amplification of the low concentration DNA samples will allow detection of the all community standard species in the correct abundance.
16S Library Preparation Methodology
To determine if the diluted samples with low DNA concentrations (1:100 to 1:1000000 dilution) could be amplified to detect signal, 16S PCR amplification was performed on the samples extracted by the ZymoBIOMICS DNA Microprep Kit with the Qiagen Vortex Adapter (see Comparison of DNA Extraction Methods) using the YouSeq 16S NGS Library preparation kit (figure 1).
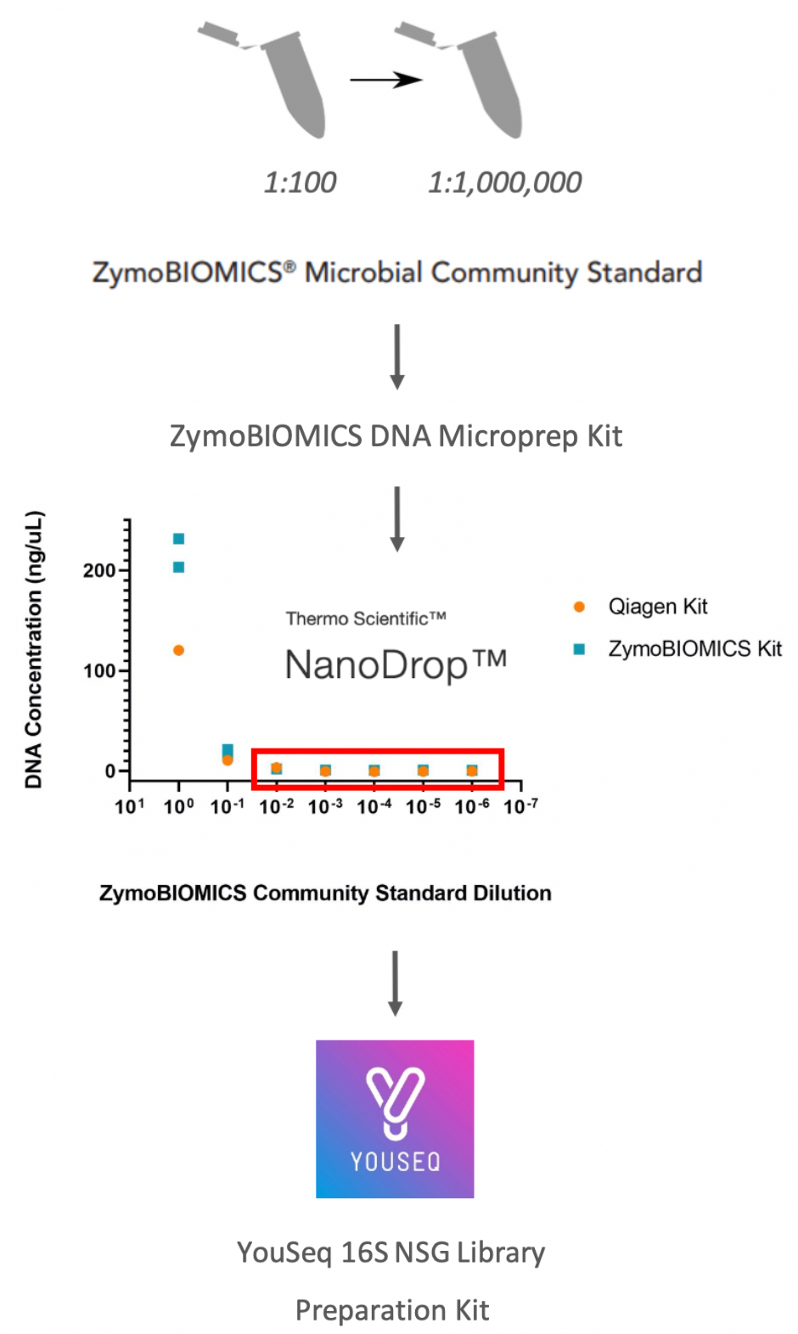 Figure 1. 16S experimental workflow
The Qiagen Vortex Adapter was selected as the homogenisation step as it had shown the best results from the shotgun sequencing of the ZymoBIOMICS Microbial Community Standard. The type extraction kit had shown no significant difference in sequencing output and the ZymoBIOMICS DNA Microprep kit was selected (see Comparison of DNA Extraction Methods). Samples which had shown low DNA concentrations by Nanodrop analysis were selected for 16S amplification and sequencing. A diluent only control (PBS), which was ran through the extraction process, was included as a control for extraction kit contaminants. The ZymoBIOMICS Microbial DNA Standard (#D6305) consists of DNA extracted by Zymo Research from the same Community Standard and served as a 16S PCR positive control. dH2O was used as a no sample negative control for the 16S PCR reaction.
The ZymoBIOMICS Microbial Community Standard has an approximate concentration of 1.4x10^10 cells/mL, 99.53% of these are bacterial cells and the remaining 0.47% are yeast. Table 1 outlines the number of cells extracted for each dilution per condition using this approximation. Table 1 also shows the resulting DNA concentration and DNA yield from each extraction using NanoDrop analysis.
Table 1. Approximate number of cells extracted for each dilution and the concentration and yield of DNA from these extractions measured by NanoDrop
| ZymoBIOMICS Community Standard | Concentration (Cells/mL) | Total cells per dilution tube (1500uL) | Total cells added per extraction condition (200uL) | Nanodrop DNA concentration (ng/uL) | Total DNA yield (ng) |
|---|---|---|---|---|---|
| 1:100 | 140000000 | 210000000 | 28000000 | 2.1 | 42 |
| 1:1000 | 14000000 | 21000000 | 2800000 | 1 | 20 |
| 1:10000 | 1400000 | 2100000 | 280000 | 0.7 | 14 |
| 1:100000 | 140000 | 210000 | 28000 | 0.9 | 18 |
| 1:1000000 | 14000 | 21000 | 2800 | 0.8 | 16 |
| PBS Control | – | – | – | 1 | 20 |
| ZymoBIOMICS DNA Standard (#D6305) | – | – | – | Supplied at 10ng/uL | – |
Results
16S Library Preparation
PCR band detection
The two-step PCR process was performed according to the manufacturer’s protocol. Briefly, PCR reaction 1 amplifies the 16S region and PCR reaction 2 adds the unique adapter/indexes to the amplified sequences for pooling. Prior to PCR reaction 2 and pooling, the remaining sample from PCR reaction 1 was ran on a 1% agarose gel to determine if a single DNA product was amplified and if low concentrations of DNA could be detected following amplification. The agarose gel showed that a single PCR product was detected, indicating no non-specific products were generated by the PCR reaction. Sample dilutions of 1:100 (~28000000 cells) to 1:100000 (~28000 cells), where DNA had not previously been detected above baseline by Nanodrop, showed a single band following 16S PCR amplification. Although still detectable, the band intensity decreased with increasing dilution and no band was detectable at 1:1000000 dilution (~2800 cells) (figure 2). Both the PBS kit control and the PCR water control showed no band, indicating no contamination from either the extraction kit components or PCR kit components respectively. A single band was detected in the ZymoBIOMICS Microbial DNA standard lane (figure 2).
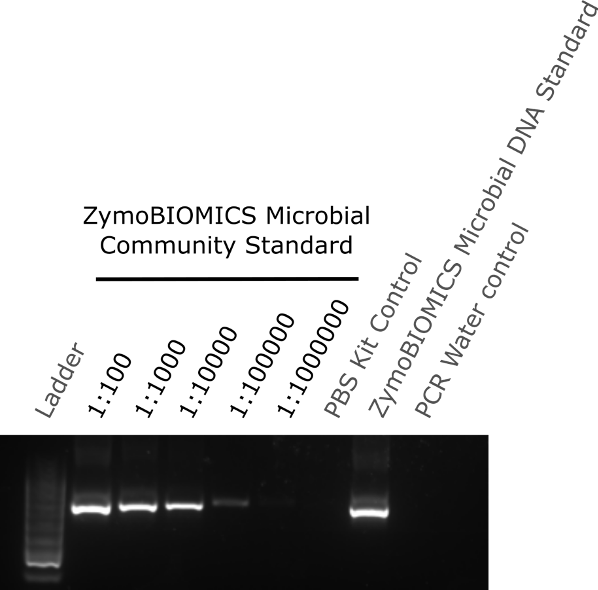 Figure 2. Agarose gel of extracted diluted community standard samples and controls amplify by 16S PCR
YouSeq The One™ 16S NGS kit
YouSeq subsequently updated the 16S library preparation kit to incorporate the 16S amplification and the barcoding into one qPCR protocol (The One™ 16S NGS kit). The samples outlined used above were ran again using The One™ 16S NGS kit’s instructions. Relative ratios were calculated from the qPCR ct values as described in the protocol and samples pooled as outlined in table 2.
Pooled samples were shipped to YouSeq for Illumina sequencing.
Table 2. Pooling of samples for 16S library sequencing
| ZymoBIOMICS Community Standard | Ct | Relative amount | Volume added (x20) (uL) |
|---|---|---|---|
| 1:100 | 18.482 | 0.62 | 12.4 |
| 1:1000 | 23.977 | 0.81 | 16.2 |
| 1:10000 | 24.849 | 0.84 | 16.8 |
| 1:100000 | 29.721 | 1 | 20 |
| 1:1000000 | - | 1 | 20 |
| PBS Control | - | 1 | 20 |
| ZymoBIOMICS DNA Standard (#D6305) | 17.157 | 0.58 | 11.6 |
| dH2O PCR Control | - | 1 | 20 |
| Total volume | 137 |
16S Sequencing Analysis
Samples were processed through the Dada2 pipeline and standard analysis by Nick Ilott. Quality of raw sequencing data was assessed using FastQC (v0.11.07). Following quality assessment, downstream processing was performed using dada2 (PMID:27214047) which was implemented in pipeline_dada2.py from the (NGSKit repository>). Given the drop in quality at ~200bp, it was decided to proceed with the analysis using the first read in the pair (V3 region). The filterAndTrim function in dada2 was used to truncate the reads to 200bp. Retained primer sequences were removed from reads (17bp) which resulted in final read lengths of 183bp. Error learning, de-replication and sample inference were performed using dada2 with default parameters. Taxonomy was assigned to amplicon sequence variants (ASVs) using the assignTaxonomy function in dada2 and the (NCBI RefSeq training data>). 16S was only reliable up to the Genus level. 16S abundance is also different for the different bacterial species within the ZymoBIOMICS Community Standard, and therefore the expected abundance is different compared to shotgun metagenomic sequencing (table 3).
Table 3. Expected composition of taxa present in the ZymoBIOMICS community standard based on 16S or shotgun metagenomic sequencing
| Species | Expected 16S rRNA abundance % | Expected Shotgun metagenomics abundance % |
|---|---|---|
| Pseudomonas aeruginosa | 4.2 | 12 |
| Escherichia coli | 10.1 | 12 |
| Salmonella enterica | 10.4 | 12 |
| Lactobacillus fermentum | 18.4 | 12 |
| Enterococcus faecalis | 9.9 | 12 |
| Staphylococcus aureus | 15.5 | 12 |
| Listeria monocytogenes | 14.1 | 12 |
| Bacillus subtilis | 17.4 | 12 |
| Saccharomyces cerevisiae | NA | 2 |
| Cryptococcus neoformans | NA | 2 |
Comparison of sample similarity showed the serially diluted ZymoBIOMICS Microbial Community Standard samples clustered with the ZymoBIOMICS Microbial DNA Standard positive control, while the negative control - PBS kit control and the dH2O PCR control - clustered separately (figure 3). As the sample dilution increased, the ZymoBIOMICS Microbial Community Standard samples separated away from DNA standard positive control (figure 3).
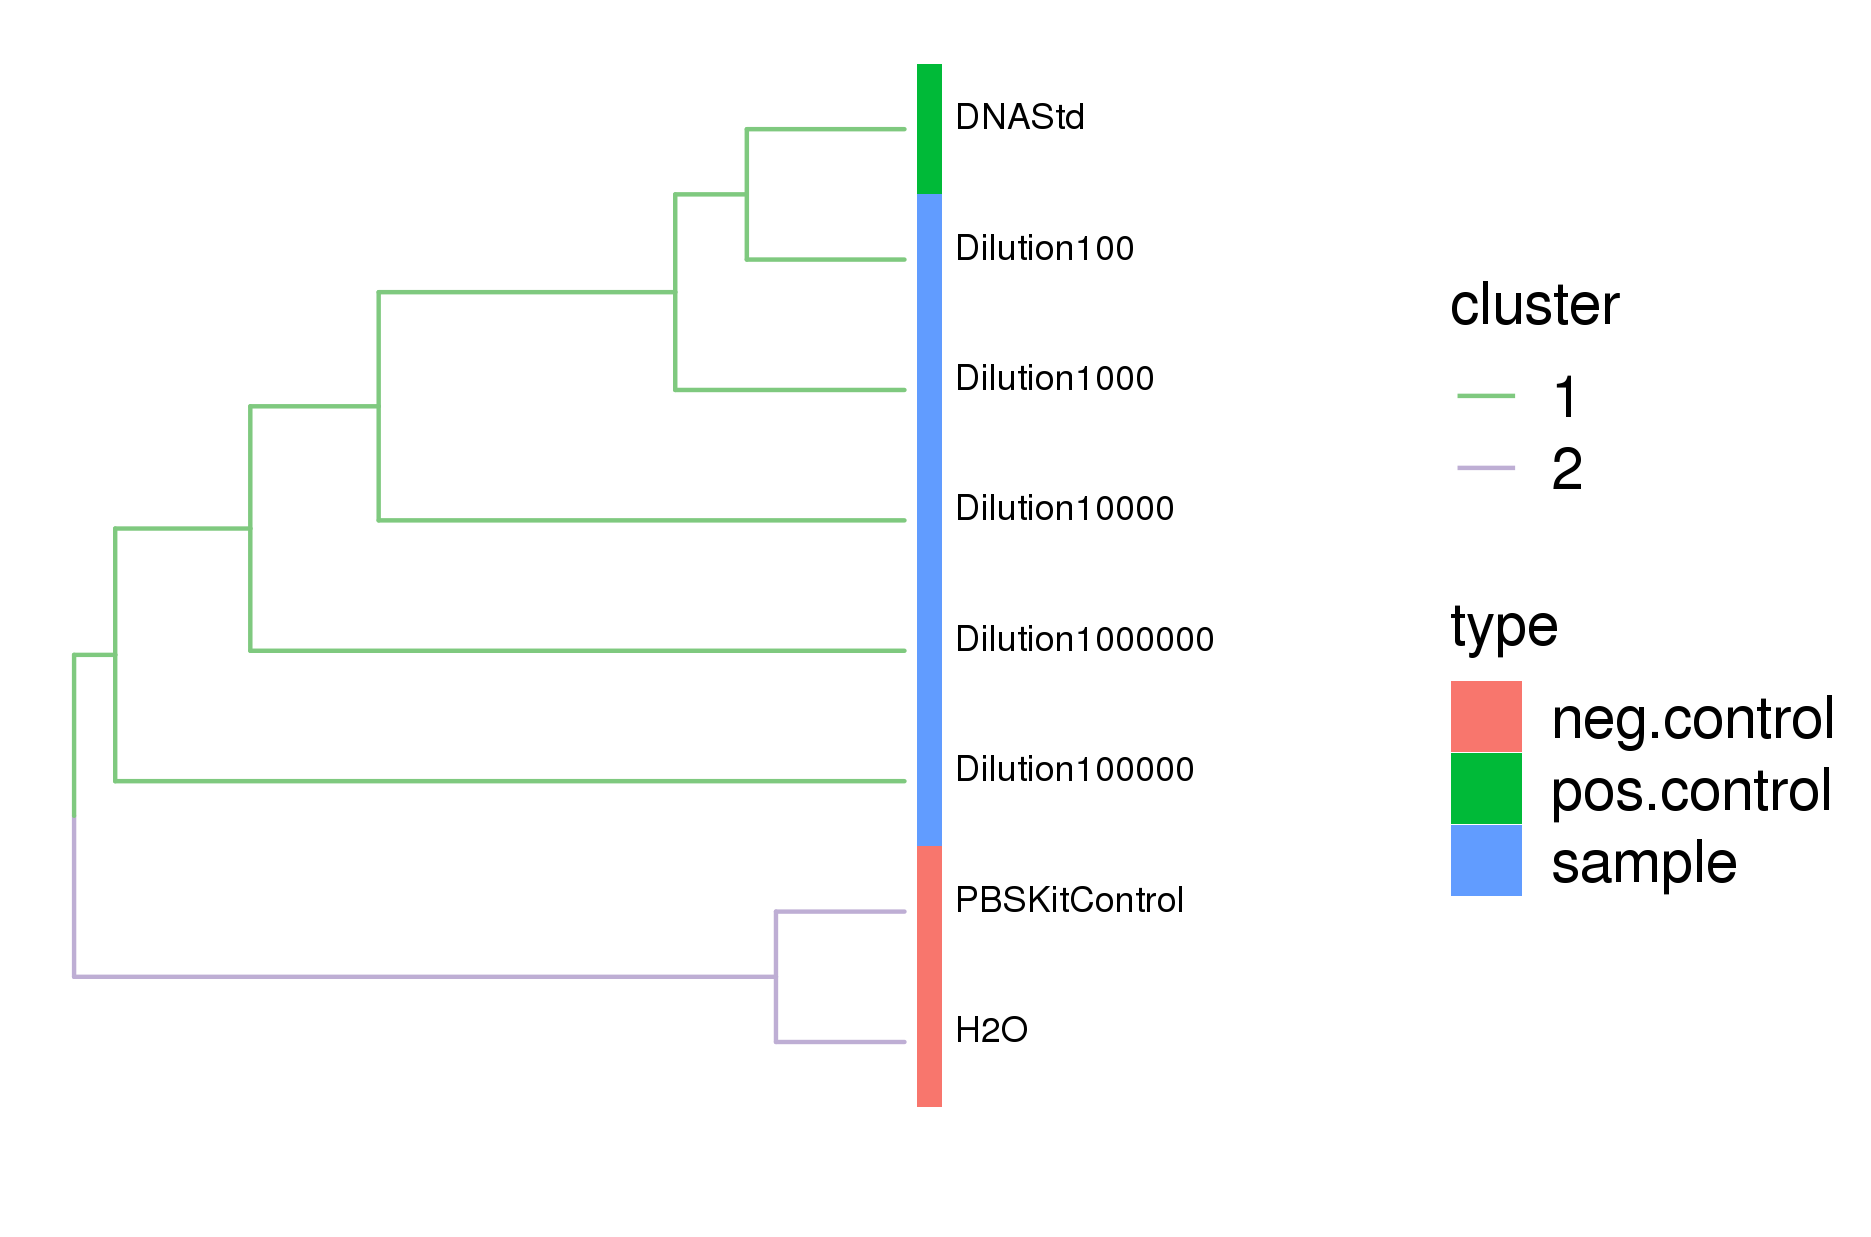 Figure 3. Dendrogram comparison of all samples sequenced by 16S showed that the diluted samples cluster with the ZymoBIOMICS Microbial Community DNA Standard while the negative control samples clustered separately.
All 8 genera of bacteria were recovered from the ZymoBIOMICS Microbial DNA standard and the serial dilution of the ZymoBIOMICS Microbial Community Standards (figure 4). The most striking observation from the 16S sequencing analysis, was at dilutions of 1:100000 and 1:1000000; corresponding to approximately 28000 and 2800 cells respectively, the % reads began to decrease, indicating reads were assigned to other bacteria not in the Microbial Standard. At 1:1000000, corresponding to 2800 cells, the full complement of microbes was observed by sequencing, where a band was not detected in the agarose gel (figure 2). The 16S PCR no template control showed no reads assigned to that sample, indicating no contamination was introduced at the PCR stage (figure 4). However, the kit control, where only PBS had been processed through the DNA extraction kit, showed low levels of reads (~15%) assigned to 4 different genera (figure 4). The dada2 pipeline only identifies microbes within the standard and is not configured to identify non-microbial community standard contamination. The presence of these 4 genera within the kit control sample indicates that the ZymoBIOMICS DNA Microprep Kit may potentially contribute contaminates, which can be detected by 16S PCR amplification. Equally, it cannot be ruled out that cross contamination from the lower dilutions of standard itself could have contaminated this control. The configuration of the data2 pipeline means the presence of contamination is likely an underestimate, as unassigned genera are not identified.
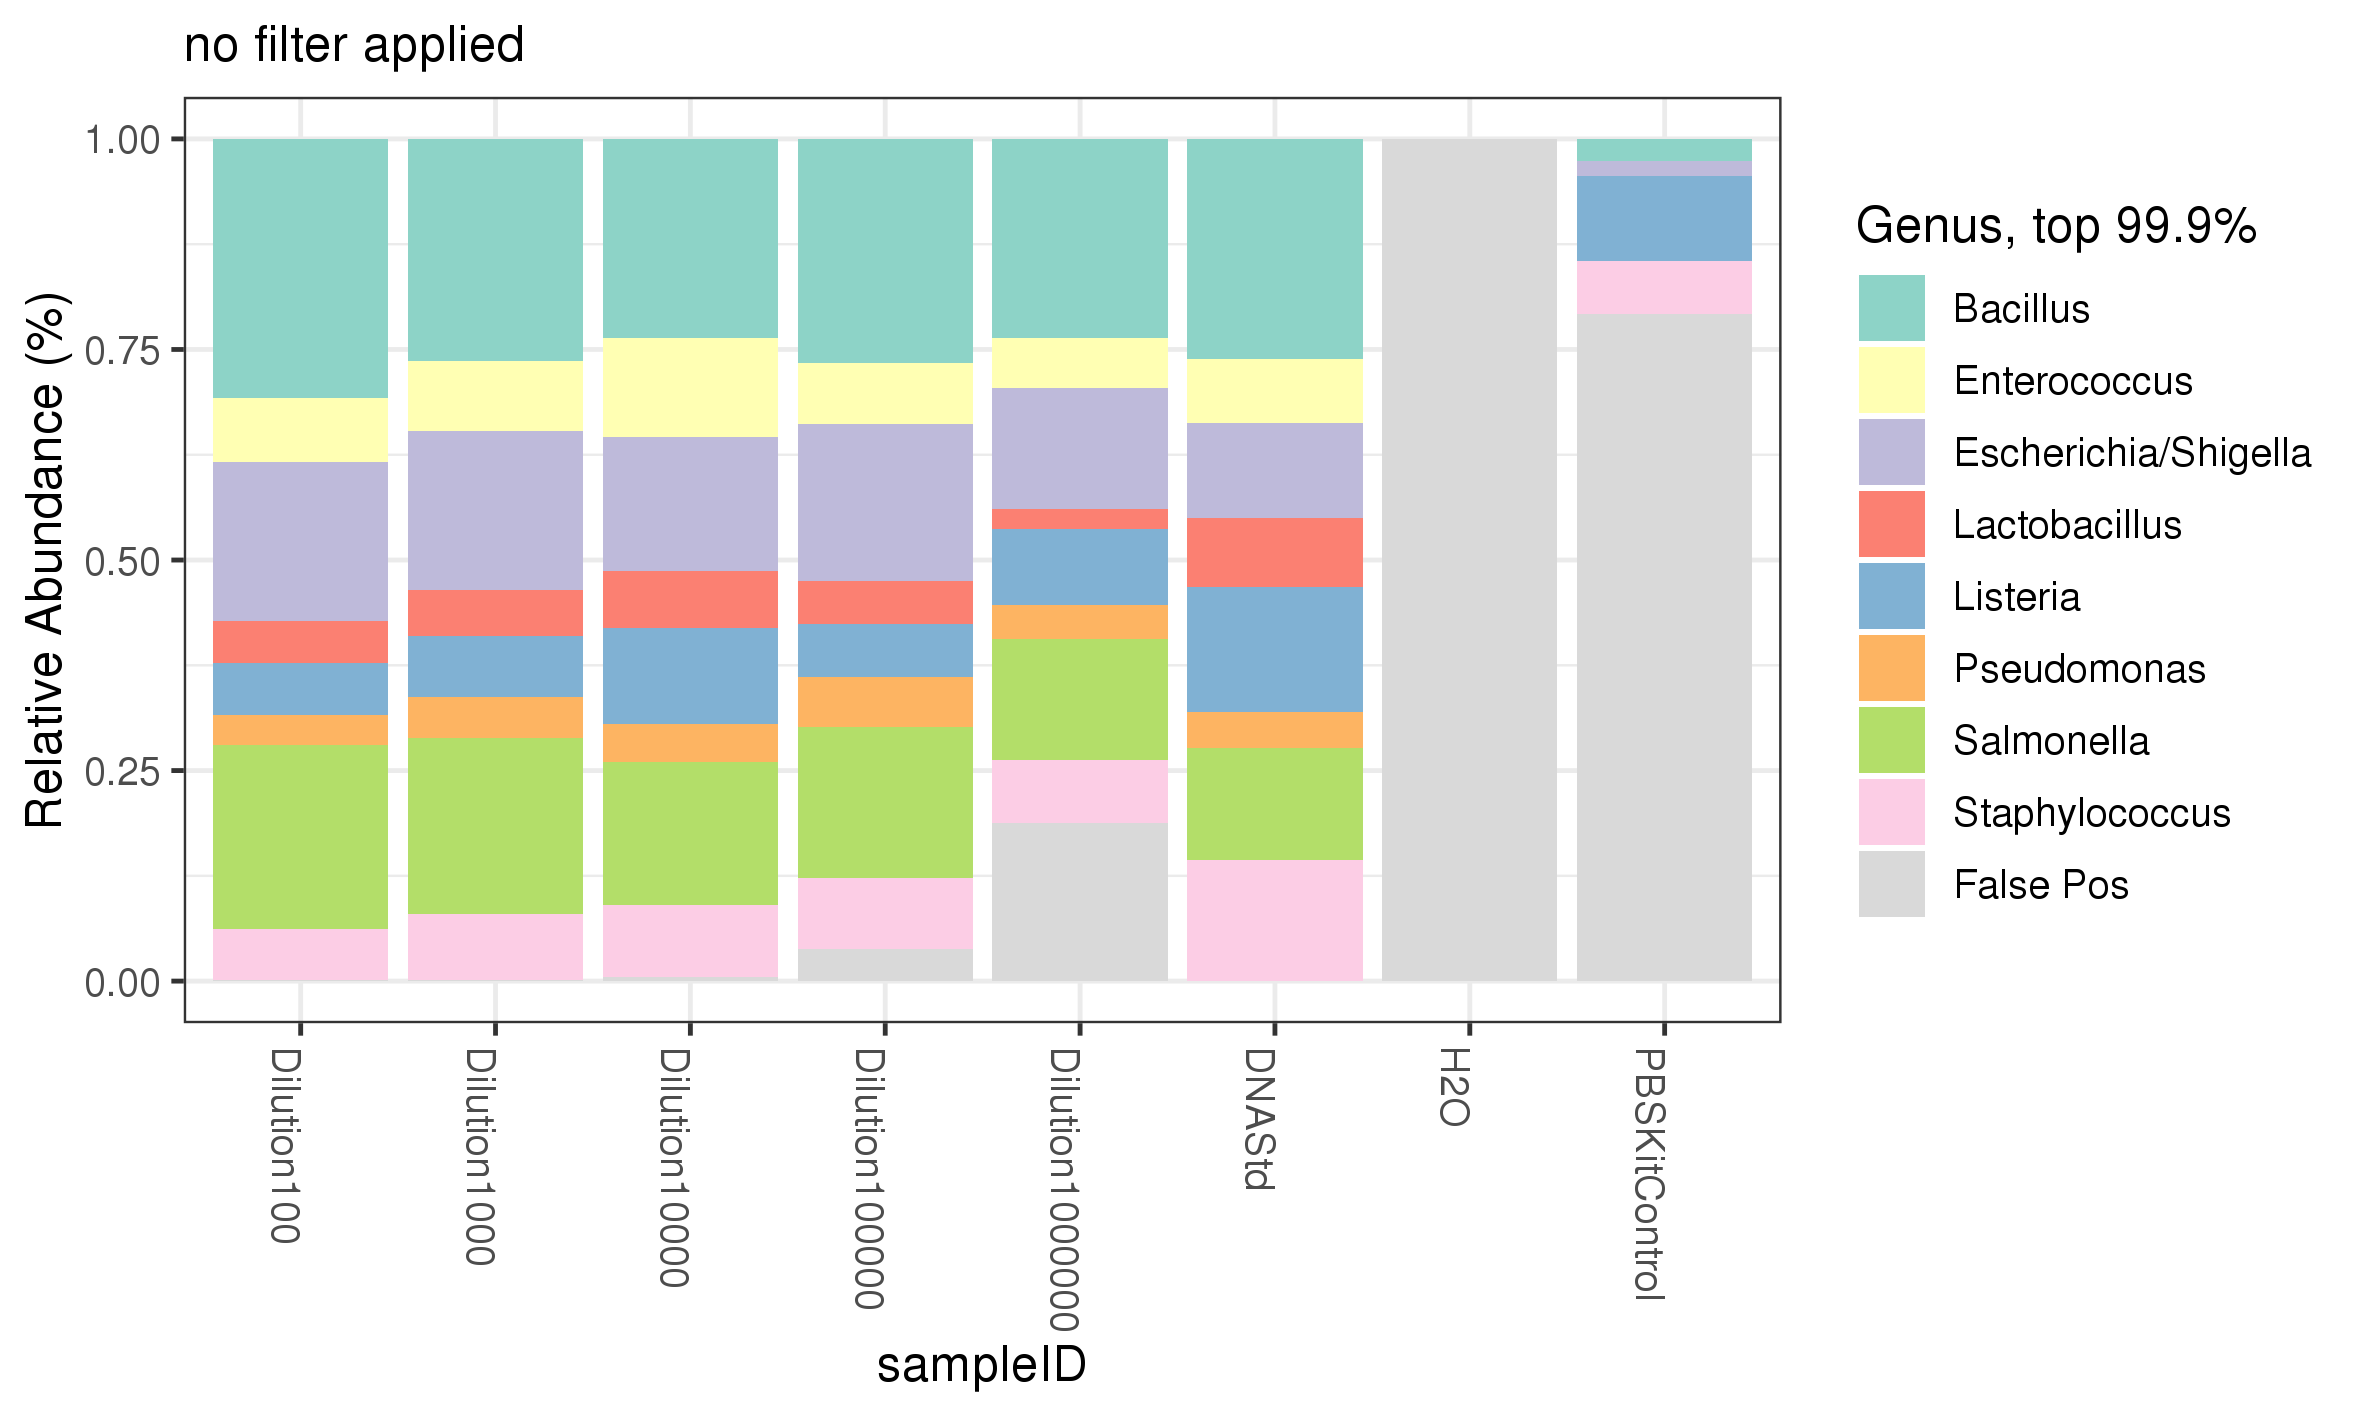 Figure 4. 16S sequencing analysis identifying genera of microbes present in diluted samples of the ZymoBIOMICS Microbial Community Standard compared to expected abundances.
While all 8 genera of bacteria were recovered from the the serial dilution of the ZymoBIOMICS Microbial community standard in comparable % abundance between different serially diluted samples, it is important to adjustment for number of reads returned from the sequencing in order to have confidence in the data and know the limitation of the experiment. The more dilute a sample the less reads are returned, despite the % abundance of genera within each sample being comparable (figure 5) versus (figure 4). Performing this adjustment shows that the number of reads contributed from the PBS Kit control was negligible. In addition, as the dilution increased the number of reads predictably decreased (figure 5). Above a 1:10000 dilution the mean number of reads dramatically dropped however, all bacteria within the ZymoBIOMICS Community standard were still detectable (figure 4). This data suggest that a) the ZymoBIOMICS Microbial Community Standard can be diluted 1:10000, (or down to ~280000 bacterial cells) and still return all bacteria within the standard with a mean read count equivalent to lower dilutions when 16S amplification is used and b) 16S can be used to detect 280000 bacterial cells Table 1 of different genera (theoretically 35000 of a single genus) within a diluent - here our diluent is PBS but it could conceptually be other bacteria, faecal matter or saliva, etc.
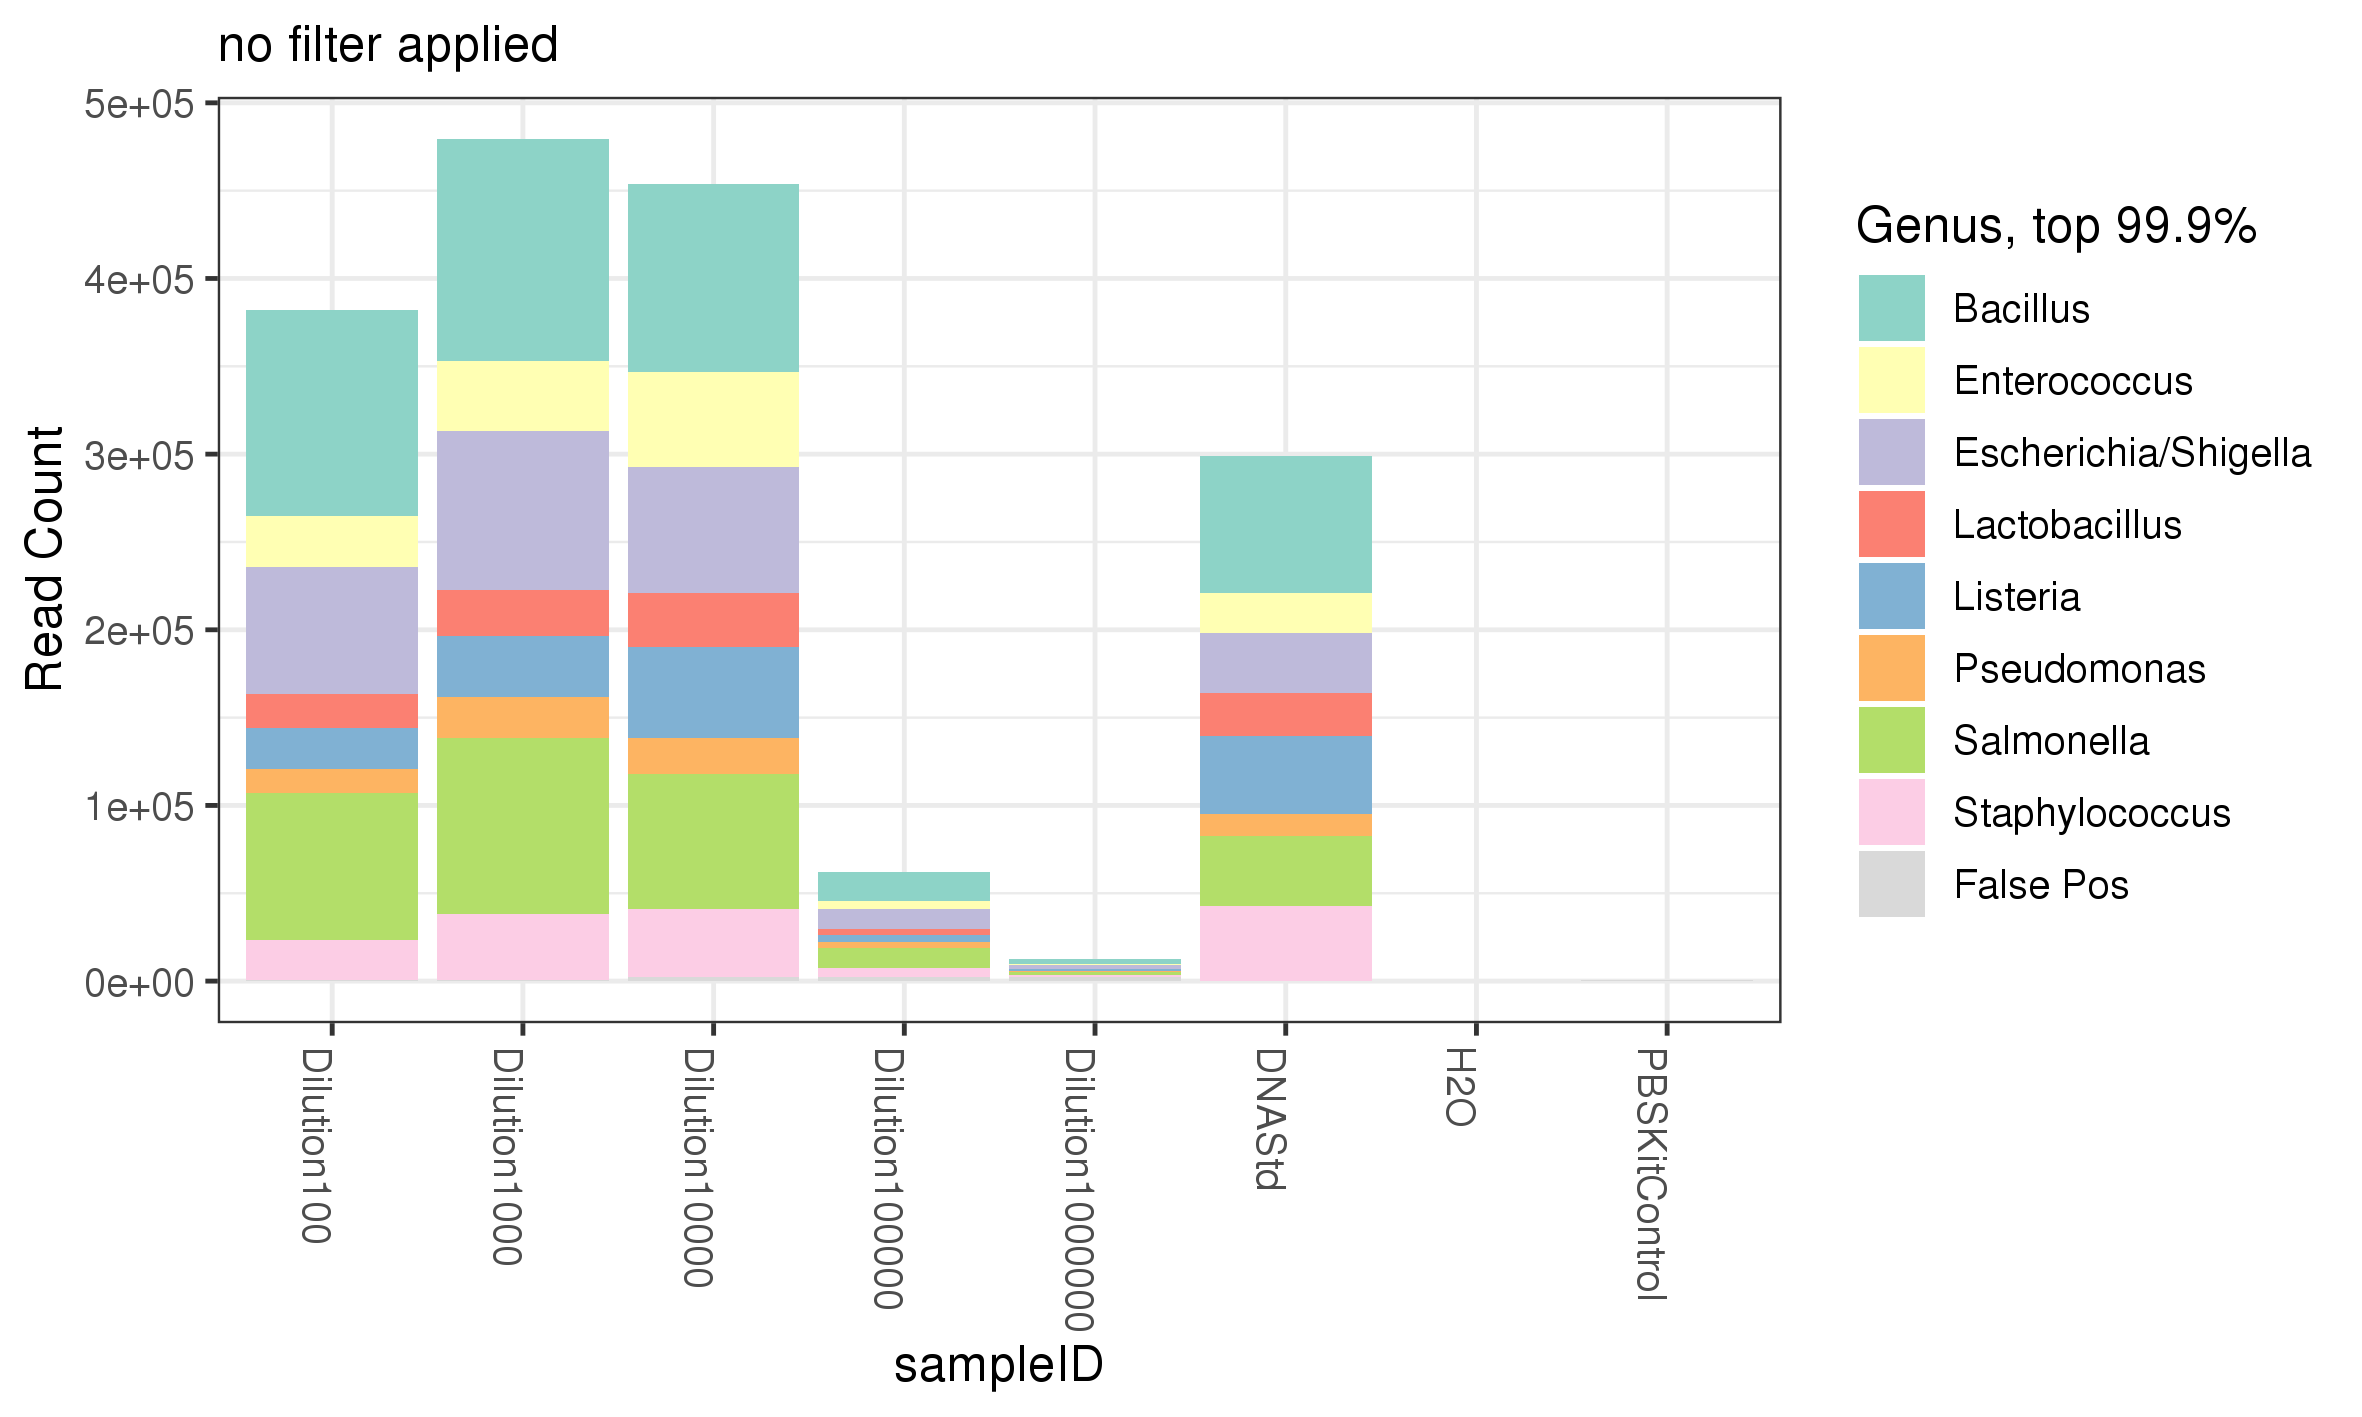 Figure 5. The abundance of each genus represented by the number of reads.
The analysis of the 16S sequencing data showed that Lactobacillus fermentum showed a relatively low abundance in all samples including the DNA standard, despite having the largest predicted 16S rRNA abundance (table 3 and (figure 4). This may indicate that Lactobacillus is difficult to extract, amplify or detect at lower concentrations by 16S sequencing, as the shotgun metagenomic sequencing showed a good recovery of Lactobacillus fermentum (see Comparison of DNA Extraction Methods).
Summary
- Products of the 16S amplification ran on a gel showed that samples with low DNA concentrations, by Nanodrop analysis, can be amplified to detect DNA bands down to a 1:100000 dilution of a simply microbial community, which corresponds to approximately 28000 total cells.
- No bands were detected in the PBS only kit control or the no template control of the 16S PCR reaction.
- 16S sequencing of the pooled library revealed that all of the microbes within all dilutions of the ZymoBIOMICS Microbial Community Standard could be detected at the genus level.
- Sample dilutions of 1:100000 and 1:1000000, corresponding to approximately 28000 and 2800 total cells respectively, showed decreased percentage of reads however, all microbes were still present.
- No reads were assigned PCR no template control, while the PBS kit only control showed some low-level contamination, indicating some potential experimental contamination, either environmental or cross.
- Incorporation of the mean read number analysis shows that any PBS control kit contamination resulted in negligible read numbers.
- Incorporation of the mean read number showed that as few as 280000 bacterial cells within a mix of 8 genera, or theoretically 35000 of a single genera, can be detected by 16S PCR and sequencing.
Acknowledgements
The OCMS is extremely grateful to Jim Wicks of YouSeq for providing the 16S NGS kit and The One™ 16S NGS kit and sequencing our pooled library.